Your energy bills are rising again, even though your solar panels worked perfectly when first installed. Many of our clients face this same issue and ask if their panels have stopped working.
Solar panels require regular upkeep to deliver optimal results. Your smart investment could become frustrating as dirt, dust, and weather can cut efficiency by up to 25%. Most homeowners don’t notice their panels need cleaning until their power generation has dropped substantially.
Our team has restored thousands of solar panel systems back to peak performance. We’ve learned about the seven clear signs your solar panels need cleaning. These key indicators will help protect your solar investment and keep your energy costs down. Here are the warning signs you can’t afford to ignore.
Decreased Power Generation
Solar panel performance shows a steady decline through monitoring systems. Quality panels naturally lose efficiency as they age. Most panels degrade at a rate between 0.5% and 0.8% annually. Your panels will generate 12-15% less power when they reach the end of their 25-30 year lifespan. System performance tracking helps distinguish normal aging from issues that need attention.
Power Output Monitoring
Built-in monitoring capabilities in modern solar systems have changed performance tracking completely. These systems capture energy production, voltage, current, and weather conditions immediately. Web portals and mobile apps display both current and historical performance data. The system alerts users automatically when production drops below expected levels.
Energy Production Metrics
These essential metrics help assess solar panel health:
- Daily energy production (kWh)
- Peak power output during sunlight hours
- Performance ratio (actual vs rated output)
- System efficiency percentage
- Grid export measurements
Power Generation Comparison
This performance comparison table identifies cleaning requirements:
| Time Period | Expected Output | Actual Output | Action Needed |
|---|---|---|---|
| Normal | 100% | 95-100% | Regular monitoring |
| Minor Issue | 100% | 85-95% | Schedule cleaning |
| Major Issue | 100% |
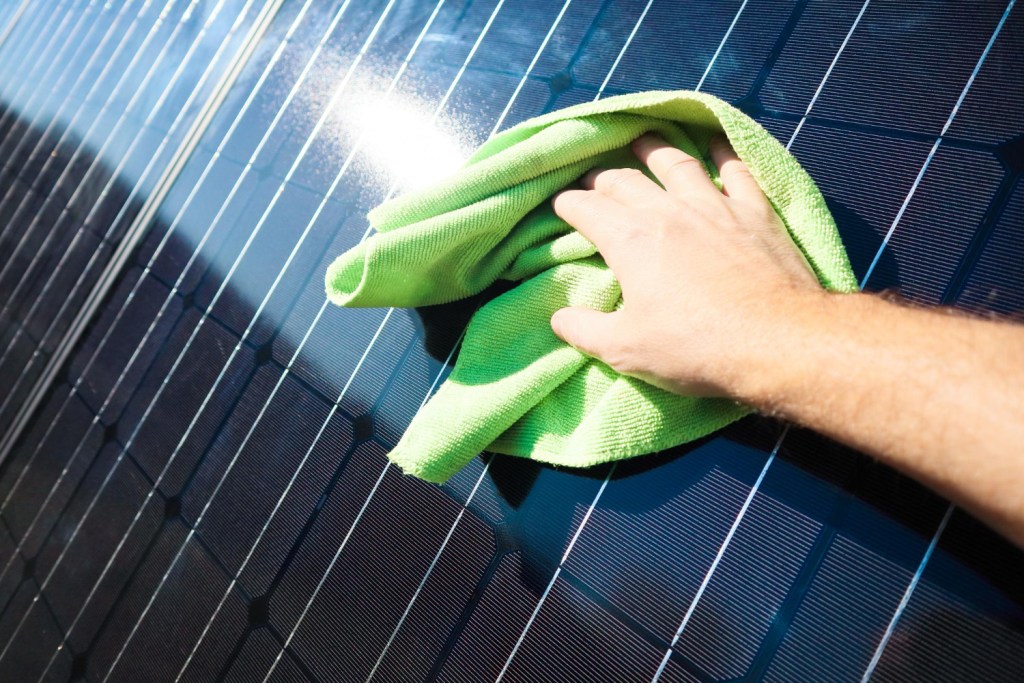
Visible Dust and Debris

Image Source: MIT News
A dirty layer blocks sunlight from reaching the photovoltaic cells and cuts power output by 1% to 25%, depending on how much grime has collected.
Dust Accumulation Patterns
Winds sweep dust particles smaller than 500 micrometers onto panels. These tiny particles create an even coating that blocks more sunlight than bigger particles do. Desert locations see efficiency drops up to 40% just from dust. Morning dew makes things worse by cementing the dust firmly to the glass.
Debris Types Effect
Regular inspections reveal several common debris types:
- Environmental Debris
- Wind-blown dust and sand
- Seasonal pollen deposits
- Fallen leaves
- Wildfire ash and soot
Each material damages panels in its own way. Bird droppings contain acids that eat away at panel surfaces. Dead insects stick to the glass and create organic layers. These materials mix with morning moisture to form a stubborn coating that persists through rainstorms.
Surface Inspection Guide
Here’s a proven inspection process:
| Inspection Area | What to Look For | Warning Signs |
|---|---|---|
| Panel Surface | Color changes | Brownish tint |
| Glass Clarity | Light reflection | Dull appearance |
| Edge Areas | Buildup patterns | Thick residue |
| Corner Zones | Debris collection | Dark patches |
Regular visual checks each month help spot issues early. You can check panels from ground level with binoculars or a zoom camera. Watch for color changes on the surface and focus on panel edges where debris tends to collect first.
City environments show unique soiling patterns from fine particle pollution. These sticky particles need special cleaning approaches. Storms and nearby wildfires leave ash deposits that stick to surfaces and often need professional cleaning services.
Rising Energy Bills
Rising electricity bills often signal the first warning of solar panel problems.
Bill Analysis Methods
Your current bills should be compared with records from your initial panel installation period. Clean panels that are properly managed can reduce electricity bills by up to 90%. Here’s the quickest way our customers track their monthly energy costs:
- Record monthly bill totals for the past year
- Calculate average daily energy usage
- Compare costs during peak vs off-peak hours
- Document weather patterns during billing cycles
Cost Impact Assessment
Dirty panels leave a clear signature on your power bills. Measurements show cost increases between 5% to 20% when panels need cleaning. This table shows typical bill changes we’ve observed:
| Panel Condition | Bill Impact | Time Period |
|---|---|---|
| Clean Panels | Baseline | First 3 months |
| Light Soiling | +5-10% | 3-6 months |
| Heavy Soiling | +15-20% | 6-12 months |
| Severe Build-up | +25-30% | 12+ months |
Energy Consumption Patterns
Solar panel efficiency drops gradually through different seasons and conditions. Data shows subtle increases in energy bills initially. Changes appear first in morning and afternoon generation patterns, then mid-day output decreases. Homes with dirty panels pull more power from the grid during peak hours, which leads to higher rates and reduced solar credits.
Your utility company’s bidirectional meter measures energy flow in both directions. Reduced energy credits on your bill reflect the effects of dirty panels. The monitoring system detects less power returning to the grid, which means you buy more electricity instead of generating it. A proper cleaning can restore these credits to normal levels within one billing cycle.
Water Spots After Rain
Rain spots on solar panels create more problems than solutions. Water spots from rainfall reduce panel efficiency and can permanently damage panels when left untreated. Measurements reveal that mineral deposits from hard water can decrease power output by up to 25%.
Rain Effect Analysis
Water droplets disrupt solar panels based on sunlight angles. Tests reveal efficiency drops at angles above 30 degrees. The droplets work like tiny magnifying glasses and concentrate sunlight in harmful ways. Spotted areas show temperature spikes of 10-15 degrees, which leads to reduced power generation.
Water Spot Formation
Hard water leaves mineral deposits on panel surfaces. Calcium, magnesium, and iron are the main elements that cause water spots. This table shows how different water types affect panels:
| Water Type | Mineral Content | Impact on Panels |
|---|---|---|
| Hard Water | High calcium/magnesium | Forms permanent spots |
| Rainwater | Medium mineral content | Creates surface spots |
| Deionized Water | No minerals | Safe for cleaning |
Areas with high mineral content in water supplies face worse spotting issues. Scaling develops gradually and leaves permanent marks on the glass surface. These deposits block sunlight and create damaging hot spots on the panels.
Spot Removal Methods
Specific cleaning methods help prevent water spot damage. Never use untreated tap water to clean solar panels. Deionized or distilled water gives the best results. These tools work best for existing spots:
- Specialized solar panel cleaning solutions
- Soft brushes with extension handles
- Pure water washing systems
- Professional-grade water softening agents
Proper timing matters for the cleaning process. Early morning or evening hours work best when panels are cool. This prevents thermal shock that might crack the glass. Regular cleaning restores panel efficiency to near-original levels.
Water spots need quick action. Spots left untreated for over three months can etch into the glass surface. Mineral deposits bond with the glass and become harder to remove. Professional services use reverse osmosis water and specialized equipment to prevent spots during maintenance.
Bird Droppings Coverage

Bird droppings cause more damage to solar panels than other types of dirt. Power losses can reach up to 23.8% when panels are covered with droppings. Tests reveal that these droppings contain uric acid that damages panel surfaces. The damage extends beyond simple shading and creates lasting performance issues.
Bird Dropping Impact
Power output measurements help track how bird droppings affect solar panels. Dense shade spots from droppings block sunlight from reaching the photovoltaic cells. The affected areas experience temperature spikes up to 49°C, while nearby areas stay at normal operating temperatures. This uneven heating puts stress on panel materials and shortens their lifespan.
Coverage Assessment
Different panel tilt angles and dropping patterns show varying impacts:
| Tilt Angle | Power Loss | Risk Level |
|---|---|---|
| 0-25° | 20-23.8% | High |
| 25-60° | 15-20% | Medium |
| 60-90° | 10-15% | Low |
Horizontal or low-tilt panels face the highest risk of dropping buildup. Dropping accumulation peaks during winter months, particularly in March. Rain helps clean the panels naturally, but some droppings stick due to their adhesive nature.
Prevention Strategies
These proven methods protect panels from bird damage:
- Install protective mesh barriers
- Mount bird spikes on panel edges
- Use automated bird repellent systems
- Place reflective mirrors near panels
- Schedule regular professional cleaning
Mesh barriers offer the best protection against bird access. The barriers need proper spacing to prevent nest building while allowing airflow to cool panels. Motion sensors in automated repellent systems detect birds and emit sounds or lights to deter them.
A regular cleaning schedule prevents permanent damage from droppings. Stubborn droppings come off easily after soaking them in deionized water for 10 minutes without scratching the panel surface. Local bird activity determines the cleaning frequency, but high-traffic areas need checks every two months.
Bird proofing costs less than replacing damaged panels. Some unprotected panels needed replacement after just two years of dropping damage. The recommended prevention methods pay for themselves by helping panels maintain power output and last longer.
Pollen Film Formation
Research shows pollen creates a stubborn film on solar panels that rain can’t wash away. Power losses become noticeable in spring as trees release their pollen. The National Renewable Energy Laboratory found that pollen can reduce panel performance by up to 15% during peak season. This issue affects solar installations of all sizes, and tree pollen causes the most damage.
Pollen Season Effects
We’ve tracked how pollen affects solar panels year-round. Cypress, juniper, pine, and oak trees produce pollen that causes the most damage. Tree pollen reaches its highest levels in spring, while grass and weed pollen peaks near summer’s end. Each pollen type adheres to panels differently, which makes some varieties harder to clean than others.
Film Development Stages
The pollen film grows in distinct phases we’ve studied:
| Stage | Time Period | Impact on Performance |
|---|---|---|
| Initial Contact | First Week | 1-3% reduction |
| Film Formation | 2-3 Weeks | 5-8% reduction |
| Heavy Build-up | 1 Month+ | 10-15% reduction |
| Post-Rain Residue | Ongoing | 5-7% reduction |
Morning dew and humidity help pollen stick more firmly to panel surfaces. The film becomes harder to remove naturally over time. Tests show that panels need proper cleaning to return to peak performance levels, even after rainfall.
Cleaning Requirements
We’ve developed specific cleaning protocols based on pollen levels. The cleaning process needs:
- Pre-inspection for pollen thickness
- Application of specialized cleaning solutions
- Soft brush cleaning with deionized water
- Performance testing after cleaning
Mechanical wet brush cleaning boosts performance by 5-11%. Professional cleaning during peak pollen season helps prevent long-term efficiency loss. Local vegetation patterns and weather conditions determine the cleaning schedule. Without planned cleaning, annual production losses can hit 10% in areas with heavy pollen.
Pollen film reduces panel performance differently than other debris. UV light absorption by pollen’s outer layer creates unique efficiency issues. The sporopollenin in pollen grains blocks certain light wavelengths from reaching the solar cells. Our teams use specialized techniques to remove this film while protecting the panel surface.
Hot Spots Development
Solar panel temperature changes signal when they need cleaning. Thermal imaging cameras detect hot spots by showing temperature variations on panel surfaces. Dirty panels tend to develop more hot spots than clean ones. These concentrated heat areas not only reduce efficiency but can permanently damage the panels.
Temperature Monitoring
Specialized sensors on each panel’s back help track temperatures. The monitoring systems send alerts when temperatures rise above the normal 40-70°C range. Temperature differences between clean and dirty sections can hit 20°C. Such variations mean the panels need immediate cleaning to protect their internal components.
Hot Spot Detection
Thermal imaging equipment shows where hot spots form on solar panels. Here’s how we find problem areas:
- Infrared camera scanning
- Back-of-module temperature sensors
- Power output monitoring
- Visual surface inspection
Temperature variations point to areas needing cleaning. Bird droppings and water spots create the worst hot spots. These spots can get 49°C hotter than nearby areas.
Heat Impact Assessment
Here’s how hot spots affect panel performance:
| Temperature Rise | Power Loss | Risk Level |
|---|---|---|
| 1-5°C | 0.4-2.5% | Low |
| 6-15°C | 2.6-7.5% | Medium |
| 16-25°C | 7.6-12.5% | High |
| >25°C | >12.5% | Critical |
Tests reveal that each degree of temperature increase cuts panel efficiency by 0.4-0.5%. Heat buildup stresses panel materials and shortens their life. Panels with hot spots lose 22% of their expected lifespan without proper maintenance.
Hot spots directly link to dirt, debris, and mineral deposit buildup. Regularly cleaned panels develop 75% fewer hot spots than neglected ones. Temperature patterns help schedule cleaning before permanent damage sets in.
Hot spot damage creates lasting problems that cleaning can’t fix. Panels with severe heat damage need replacement more often than any other failure type. Replacement costs are nowhere near the cost of regular cleaning. The monitoring systems prevent these issues by detecting temperature changes early.
Comparison Table
| Sign | Power Loss Effect | How to Detect | Development Period | Root Causes |
|---|---|---|---|---|
| Decreased Power Generation | 12-15% over lifetime | Built-in monitoring systems, performance ratio tracking | Gradual (0.5-0.8% per year) | Natural degradation, dirt buildup |
| Visible Dust and Debris | 1-25% | Visual inspection, ground checks | 3-6 months | Wind-carried particles, environmental debris |
| Rising Energy Bills | 5-30% | Monthly bill analysis, usage tracking | 3-12 months | Lower efficiency, increased grid power needs |
| Water Spots After Rain | Up to 25% | Visual checks, temperature monitoring | Right after rainfall | Hard water minerals, rain residue |
| Bird Droppings Coverage | 10-23.8% | Visual inspection, thermal imaging | Changes (peaks in March) | Bird activity, acid damage |
| Pollen Film Formation | 1-15% | Visual checks, performance monitoring | 1-4 weeks | Tree pollen, morning dew sticking |
| Hot Spots Development | 0.4-12.5% | Thermal imaging, temperature sensors | Varies | Dirt accumulation, uneven heat |
Conclusion on Signs Your Solar Panels Need Cleaning

Clean solar panels maintain optimal power generation capacity. Dirty panels lose up to 25% of their efficiency. We identified seven key signs that tell you when your panels need cleaning – from visible dust accumulation to thermal imaging that reveals hot spots.
Your solar panels need consistent monitoring to avoid permanent damage. A good cleaning schedule costs less than replacing damaged equipment and keeps energy bills low. Clean panels generate more power and have a longer lifespan.
A well-maintained solar system protects your investment. The signs we shared will guide your cleaning schedule decisions. Your panels will perform better and generate more power with the right care. Between Cleaning can help schedule your next panel cleaning service today.
